
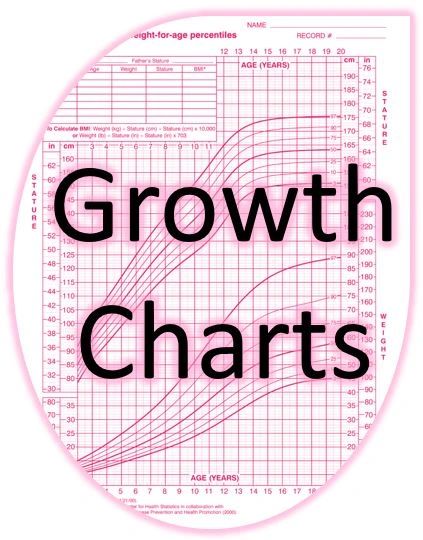
Childhood growth curves is a topic that many of us could benefit from a refresher course. Knowing the different patterns associated with certain disease processes or excess caloric intake can allow for some easy points. Regardless of whether you treat children, this topic will be high-yield for ABOM boards. Before diving into different patterns of childhood growth charts, let’s take a look at how childhood growth should be assessed (also highly testable).
The child’s age will determine which growth chart to use and how weight assessment is performed. Weight assessment in those under 2 years old is done by evaluating weight-for-length using the World Health Organization charts, taking into account sex and age. The body mass index percentile from the Centers for Disease Control and Prevention is not used until 2 years of age and is utilized until age 20. The differences in the growth charts are based on the cohort in which “normal” stature and weight for any given age and sex were factored.
- Centers for Disease Control and Prevention (CDC): These charts are based on a cohort of primarily non-breastfed, Caucasian American children. The CDC cohort data was unavailable for the first three months of age, and the sample sizes were limited for sex and age for the first six months, limiting its utility in those under 2 years of age.
- World Health Organization (WHO): This is based on cohorts from more diverse ethnic backgrounds, predominantly breastfed children. These children were breastfed for at least four months, with most still breastfeeding at 12 months.
The CDC recommends using the WHO growth standards for infants aged 0-2 years and the CDC growth charts thereafter. The WHO charts more accurately reflect the recommended standards for infant feeding in the early population. Both are readily available online.
Notably, certain populations have specialized pediatric growth/BMI charts, including patients with achondroplasia. Although patients with Down syndrome have an increased risk of obesity and use different charts for weight and height, the BMI guidelines from the CDC recommend using charts for normally developing children. This is recommended to facilitate early detection of excess weight, allowing for earlier intervention
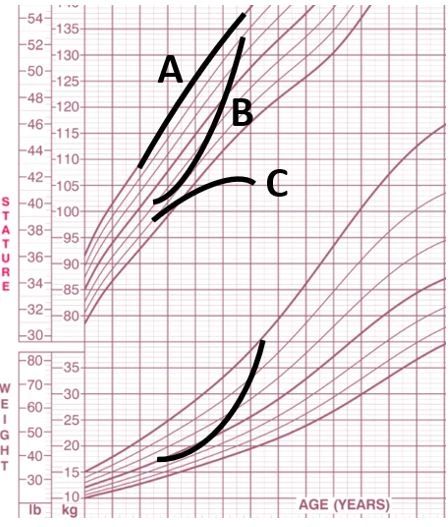
Now onto patterns seen in childhood patients. An increase in weight that traverses different percentiles (bottom black weight curve) is likely caused by excess calories or endocrinopathies. Children consuming excess calories leading to weight gain would have an upward trajectory on both the height and weight curves in a proportional manner (line B). This may clue you into a child who is drinking excessive soda or eating more calories while being more sedentary. Treatment for these children would focus on lifestyle changes, anti-obesity medications, or even metabolic and bariatric surgery. This will be the bulk of children who develop obesity.
In contrast, those with endocrinopathies such as hypothyroidism, growth hormone deficiency, or Cushing disease would develop increased weight with decreased growth velocity, leading to flattening of the stature growth curve (line C). Treatment for these individuals would involve addressing the underlying endocrine pathology. Both of these patterns should be committed to memory.
Exceptions to the generalized statements above occur in various genetic etiologies of obesity. Any questions that contain individuals with a genetic etiology of obesity will have other physical exam findings that point in that direction. Some important conditions that would present with abnormal growth curves include:
- Tall stature: Melanocortin 4 receptor deficiency leads to a persistently tall stature with increased weight.
- Short stature: Turner syndrome, Down syndrome, Prader-Willi, and Albright Hereditary Osteodystrophy would cause a patient to be persistently on a lower percentile stature curve. Easily recognizable patterns of growth charts and how to assess weight in different age groups may allow for some easy points on test day. Make sure to review this information before boards, especially if you do not work with pediatric patients!
Sample Question
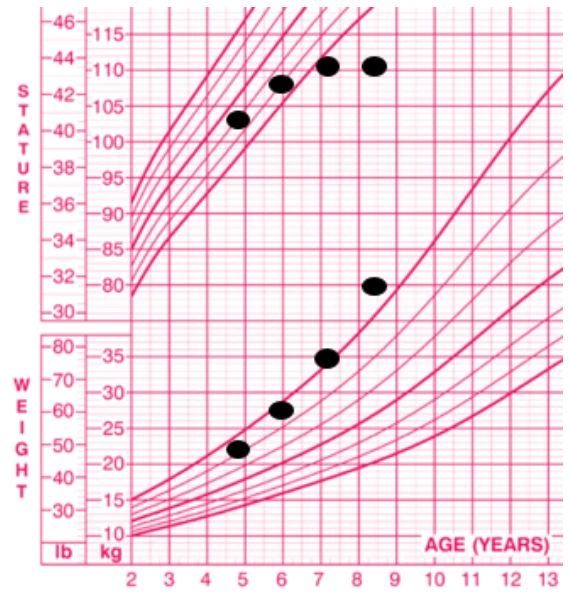
A previously healthy 9-yearold girl presents to her pediatrician for a well-child check. Her growth chart is shown. Her percentile BMI has steadily increased over the last four visits despite lifestyle changes incorporated within her family. She has breast bud development. Which of the following conditions may be contributing to these findings?
A. Excessive caloric intake
B. Precocious puberty
C. Bulimia
D. Achondroplasia
E. Hypothyroidism
Next Week: Obtaining appropriate blood pressure and waist circumference measurements
Upcoming: Monthly Knowledge Check. This is a review checklist of must-know items for ABOM exams based on the previous four blog topics (Contrave®, SADI-S, childhood growth charts, and BP & waist circumference measurements). In addition, this will include a brief explanation of the correct answers to previous sample questions.
Next Month: Homeostatic vs. hedonic eating, dietary supplements, MC4r deficiency, and obstructive sleep apnea.
For more practice questions, check out the following:
- Obesity Medicine Board Review Questions (2026): Qs 25, 85, 136, and 148.
- Obesity Medicine Practice Tests (2026): Qs 64, 91, 159, 217, and 352.
(Copyright 2026) Obesity Medicine Board Review Questions, LLC: obesitymedicinereview.com
Featured image: Modified growth chart from CDC.
Copyediting by Kelly Smith

Now available: A full line of ABOM study resources with 775+ challenging questions in a mobile or book format. Access to both formats is available in a discounted Ultimate Package, which also includes a Pass Guarantee (if you fail the exam in 2026, you get the 2027 edition free), 50 bonus questions released in August, and the newest book, Obesity Medicine: Sample Questions and Study Blogs, which includes all the updated previous study blogs in a paperback format. Check it out here!
